
Figure 2.
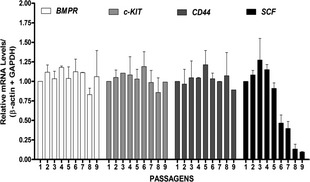
Maintenance of hMSC markers. Total RNA was isolated from hMSC cultures at different passages (1 to 9) and examined using Q‐PCR to determine changes in mRNA expression levels after normalisation to β‐actin and GAPDH expression. Analysis of fold changes in expression of SCF, CD44, c‐Kit and BMPR were performed at the different passages. Data are presented as fold induction relative to control group (passage 1). Mean ± SD (n = 9). *Statistical significance was considered at P < 0.001.