
Figure 3.
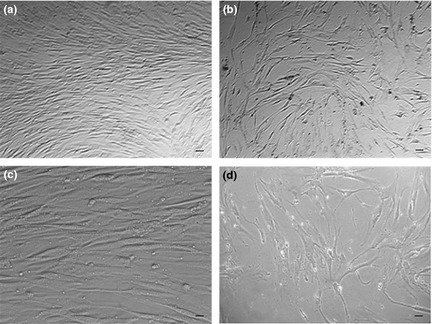
Morphologic changes indicating senescence. Using the same confluence stage, representative morphology of hMSCs is shown at early passage (P3) [(a) and (c)] and late passage (P8) [(b) and (d)]. (a) and (b): Scale bars ‐ 65 μm (40× magnification). (c) and (d): Scale bars ‐13 μm (200× magnification). Cells were seeded at the same density (2.000 cells/cm2), and at P3, the hMSC culture obtained confluence at 7 days, while at P8, confluence was obtained at 12 days.