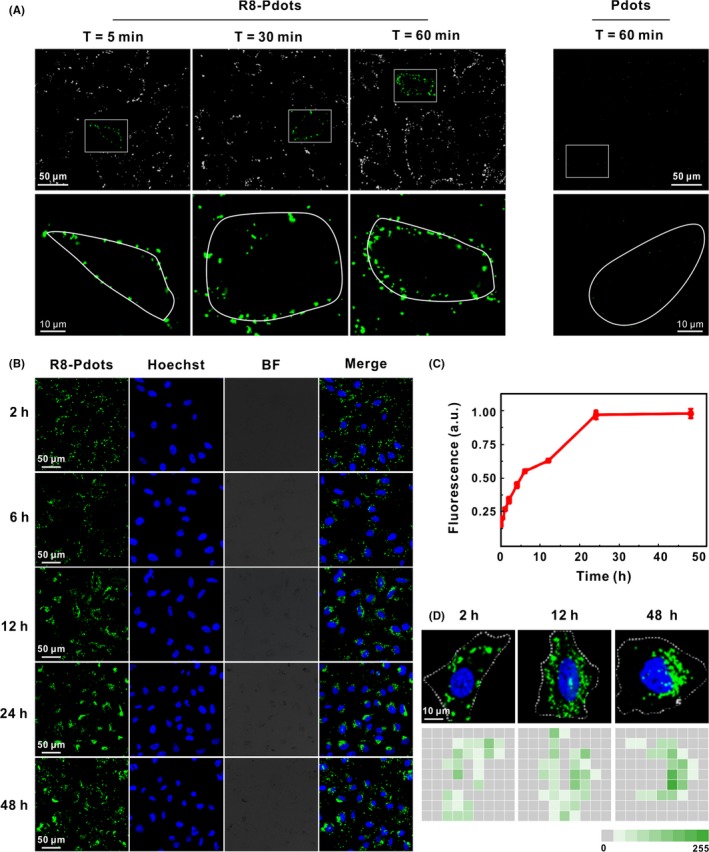
Figure 2.

Time‐dependent live‐cell imaging of R8‐Pdots. A, HeLa cells were incubated with 5 μg/mL R8‐Pdots (left) or 20 μg/mL unmodified Pdots for 60 minutes and observed using confocal microscopy. Lower panel shows magnified images of the square region in the upper panel. Cellular periphery is outlined according to bright‐field imaging. B, HeLa cells were incubated with 5 μg/mL R8‐Pdots for up to 48 hours. Intracellular fluorescence was observed using confocal microscopy at indicated time points. C, Fluorescence of internalized R8‐Pdots was quantified by flow cytometry analysis. D, Representative images of ingested R8‐Pdots at 2, 12 and 48 hours were divided into 9*9 squares, and the average fluorescence intensity in each square was counted using ImageJ scripts
