Figure 4.

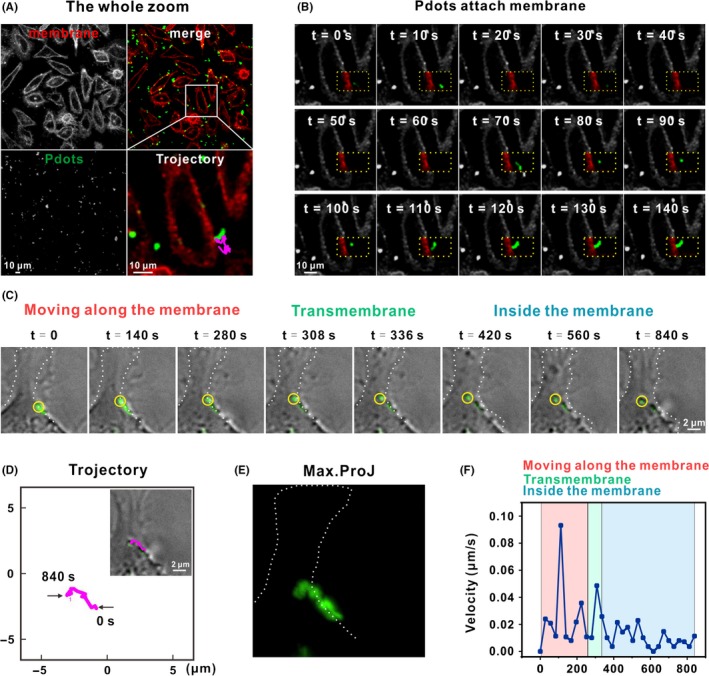
Single particle tracking of dynamic R8‐Pdots internalization. A, Confocal images of R8‐Pdots (green) internalization. Cell membrane was stained with Dil (red) 5 minutes. The samples were observed within 1 hour after staining. Trajectory of a representative particle was shown with enlarged view (one frame per 2 seconds, with a total of 140 seconds; also see Video S1). Trajectories at different time points were shown in (B). C, The whole internalization process of a R8‐Pdot particle (indicated with a yellow circle) was imaged using a DeltaVision deconvolution scanning fluorescence microscope. Z‐stacks were collected at 0.2‐μm intervals over 2 μm (one frame per 28 seconds, with a total of 840 seconds; also see Video S2). The whole process was divided into three stages. Cellular periphery is outlined according to bright‐field imaging. D, Trajectory of the representative particle. Max trajectory and instantaneous speed of selected R8‐Pdots particle were shown in (E) and (F), respectively
