Figure 1.

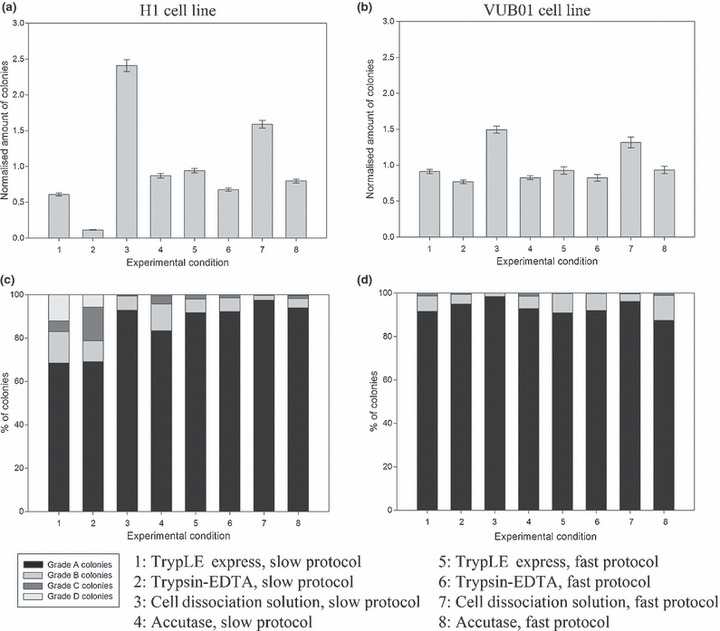
Graphical representation of normalized number of colonies and colony quality, generated in the first passage, for the different experimental conditions. The two best conditions, for both cell lines, were combination of Cell Dissociation Solution with the slow protocol and with the fast protocol. Use of Trypsin‐EDTA results in the formation of fewest colonies. TrypLE Express and Accutase™ generate intermediate amounts of colonies. (a) Bar chart of normalized number of generated colonies, under the different experimental conditions, in the first passage for the H1 cell line. (b) Bar chart of normalized amount of generated colonies, under the different experimental conditions, in the first passage for the VUB01 cell line. (c) Bar chart of colony quality, under the different experimental conditions, in the first passage for the H1 cell line. (d) Bar chart of colony quality, under the different experimental conditions, in the first passage for the VUB01 cell line.
