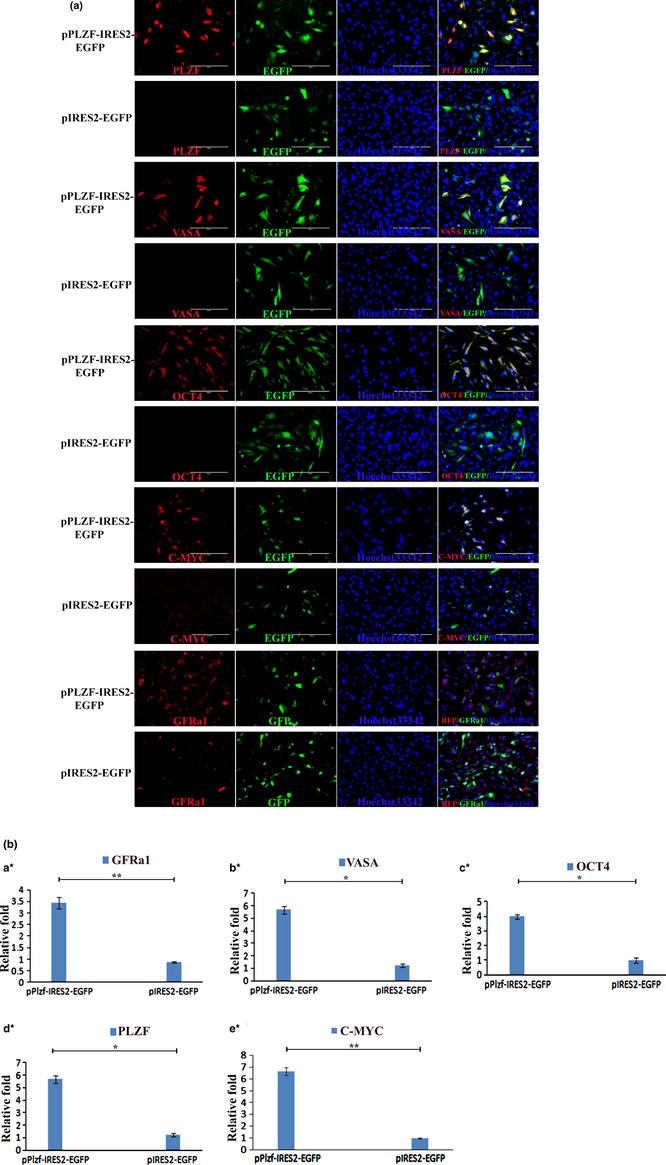
Figure 6a.

mGSC s detected by immunofluorescence staining and QRT ‐ PCR at 72 h after PLZF transfection. (a) Immunofluorescence staining analysis for PLZF, VASA, OCT4, C‐MYC, GFRa1in both pPLZF‐IRES2‐EGFP (1st and 3rd row) and pIRES2‐EGFP (2nd and 4th row) groups. Bar = 200 μm. (b) QRT‐PCR analysis for GFRa1 (a*), VASA (b*), OCT4 (c*), PLZF (d*) and C‐MYC (e*) in pPLZF‐IRES2‐EGFP groups and pIRES2‐EGFP groups. *P < 0.05; **P < 0.01.
