Figure 4.

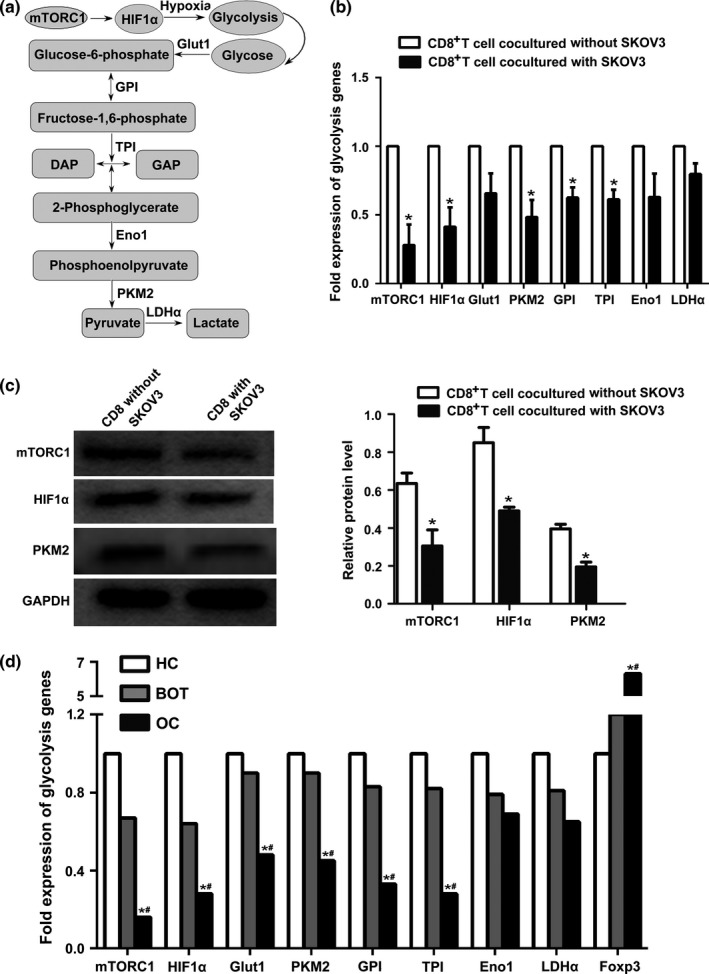
Validation of DEGs by real‐time PCR and western blotting. (a) Diagram of the glycolytic pathway, including the eight glycolysis genes (mTORC1, HIF1α, Glut1, PKM2, GPI, TPI, Eno1 and LDHα) selected for further validation. (b) Glycolysis gene mRNA expression in CD8+ T cells from the co‐culture system was detected using the RNA remaining from microarray analysis. The expression of mTORC1, HIF1α, PKM2, GPI and TPI mRNA was significantly lower in co‐cultured groups (*P<.05) compared with CD8+ T cells cultured alone. Data represent the mean ± SD. (c) Protein expression of mTORC1, HIF1α and PKM2 was analysed using western blotting. Expression of all three proteins decreased significantly in CD8+ T cells cultured with SKOV3 cells (*P<.05) compared with CD8+ T cells cultured alone. Data represent the mean ± SD. (d) Expression of glycolysis gene mRNA in CD8+ T cells from ovarian cancer patients (OC; n=22), benign ovarian tumour patients (BOT; n=20) and healthy controls (HC; n=20). MTORC1, HIF1α, Glut1, PKM2, GPI and TPI were expressed at lower levels in OC patients than in both BOT patients and healthy controls. *P<.05 compared with healthy control group, # P<.05 compared with benign ovarian tumour group
