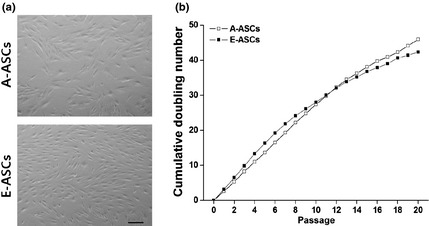
Figure 1.

Cell morphology and proliferation rates. (a) Morphological appearance of early‐passage cells. Scale bar: 200 μm. (b) Long‐term growth curves of the A‐ASCs (open) and the E‐ASCs (closed). Cell numbers were determined at the end of every passage and cumulative doubling numbers were calculated in relation to the cell numbers at the first passage.
