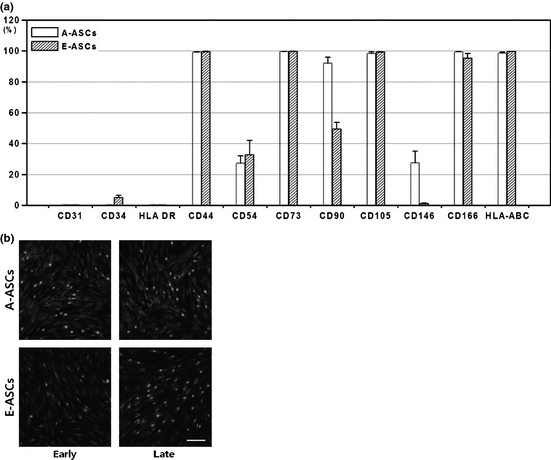
Figure 2.

Cell surface antigen expression. (a) Flow cytometric characterization of the cells. For statistical analyses, 4 A‐ASCs and 4 E‐ASCs donors were assessed in pairs. The expression of CD31, CD34 and HLA‐DR was negative, whereas that of others was positive. (b) CD90 expression was visualized by immunohistochemical staining. Cells were stained with anti‐humanCD90 antibody (green) and the nuclei were stained with DAPI (blue). Scale bar: 100 μm.
