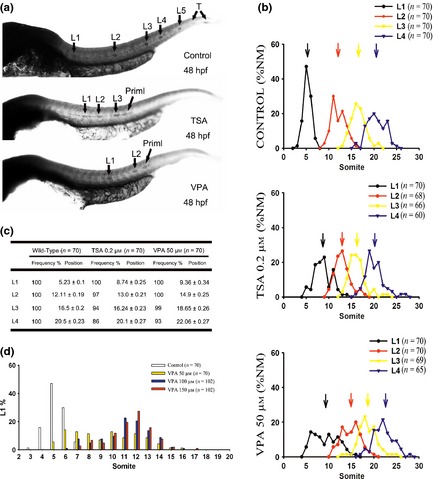
Figure 3.

Spatial distribution of neuromasts. (a) Expression of cxcr7b in the developing posterior lateral line (PLL) by whole‐mount in situ hybridization in 48 hours post‐fertilization (hpf) larvae. Displacements of PLL neuromasts were observed in 0.2 μm trichostatin A (TSA)‐treated and 50 μm valproic acid (VPA)‐treated embryos. (b) Spatial distribution of the first four neuromasts (L1–L4). The arrows indicate the average positions (NM, neuromasts). (c) Frequency and positions of the first four neuromasts at 72 hpf. The spatial distribution of the L1–L4 neuromasts in VPA‐treated embryos was clearly altered compared with untreated embryos at 72 hpf. (Position of L1: control versus VPA, P < 0.05; control versus TSA, P < 0.05. Position of L2: control versus VPA, P < 0.05; control versus TSA, P < 0.05. Position of L3: control versus VPA, P < 0.05; control versus TSA, P > 0.05. Position of L4: control versus VPA, P < 0.05; control versus TSA, P > 0.05). (d) The distribution of L1 positions (somite number) in 72 hpf embryos during VPA treatment with various dosages of inhibitor.
