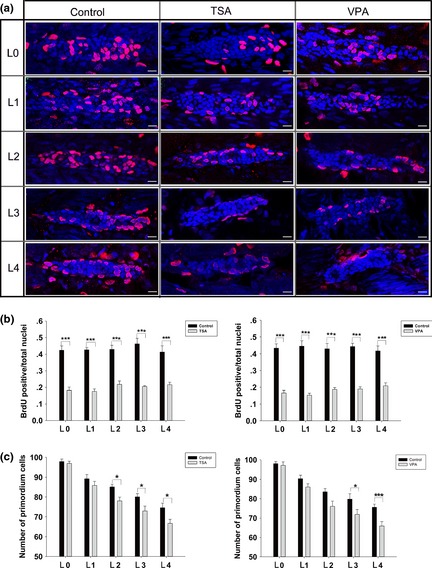
Figure 4.

Effect of histone deacetylases ( HDAC ) inhibitors on cell proliferation. (a) Cell proliferation analysis in control, trichostatin A (TSA)‐treated, and valproic acid (VPA)‐treated embryos. After the BrdU pulse, embryos were fixed before (L0; the first row) and after deposition of neuromast L1 (the second row), L2 (the third row), L3 (the fourth row) or L4 (the fifth row). In these images, nuclei are labelled with DAPI and red spots represent BrdU signal. Scale bars = 10 μm. (b) The ratio of BrdU‐positive cells to total cells in control (black bars) and HDAC inhibitor‐treated (grey bars) embryos from 0 to 4 deposited neuromasts. Total cells were counted by DAPI staining. (c) Summary of HDAC inhibitor effects on the number of primordium cells. Primordium cell analysis in control (black bars) and HDAC inhibitor‐treated (grey bars) embryos from 0 to 4 deposited neuromasts, *P < 0.05; ***P < 0.001.
