Figure 5.

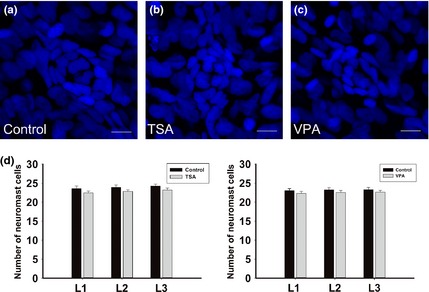
Effect of of histone deacetylases ( HDAC ) inhibitors on the number of the deposited neuromast cells. (a–c) Neuromast cell analysis in control (a), trichostatin A‐treated (b) and valproic acid‐treated (c) embryos. Embryos were fixed after deposition of neuromast L1. In these images, nuclei are labelled with DAPI. Scale bars = 10 μm. (d) Neuromast cell analysis in control (black bars) and HDAC inhibitor‐treated (grey bars) embryos from L1 to L3 neuromasts. n = 20 for all the groups.
