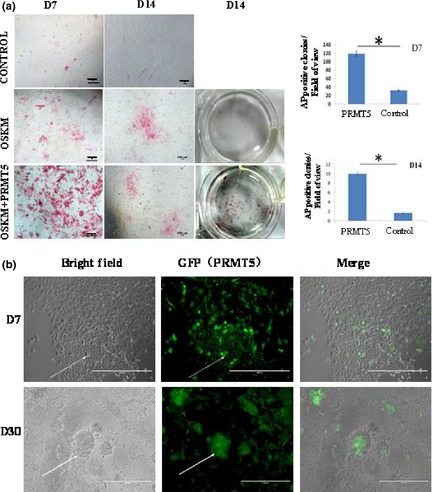
Figure 4.

Generation of dairy goat iPSC s using four defined factors (OSKM) and OSKM combined with PRMT5 (OSKMP). (a) Reprogramming efficiencies at 7 days in two groups (OSKM and OSKMP) were determined. Inset shows that overexpression PRMT5 enlarged AP positive cells. AP positive colonies in each 24‐well dish were quantified and plotted in the right panel, and number of AP positive colonies at D7 and D14 in OSKMP (PRMT5) was significantly higher than that in OSKM (Control) group, *P < 0.05. (b) Most iPS‐like clusters were GFP (PRMT5) positive.
