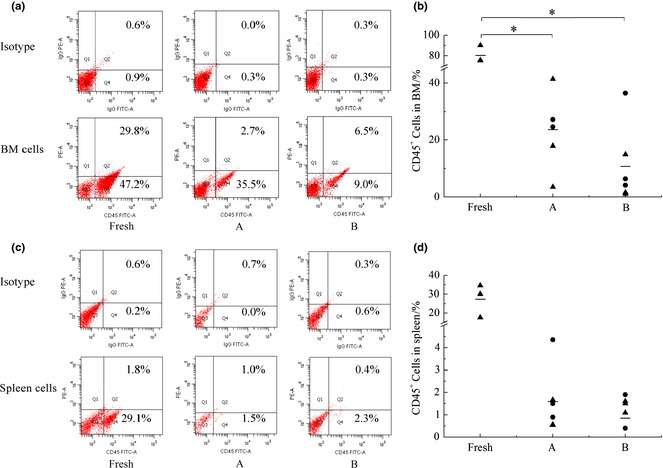
Figure 2.

Engraftment levels of expanded cells in bone marrow and spleen cells of recipient mice in different groups. (a) Representative flow cytometric analysis of human CD45+ cells in bone marrow cells of recipient mice, (b) Engraftment levels of human CD45+ cells in bone marrow cells of recipient mice in different groups, (c) Representative flow cytometric analysis of human CD45+ cells in spleen cells of recipient mice and (d) Engraftment levels of human CD45+ cells in spleen cells of recipient mice in different groups. Each black symbol represents one mouse of two independent experiment, the horizontal bars represent the median values. *Represents significant difference (P < 0.05).
