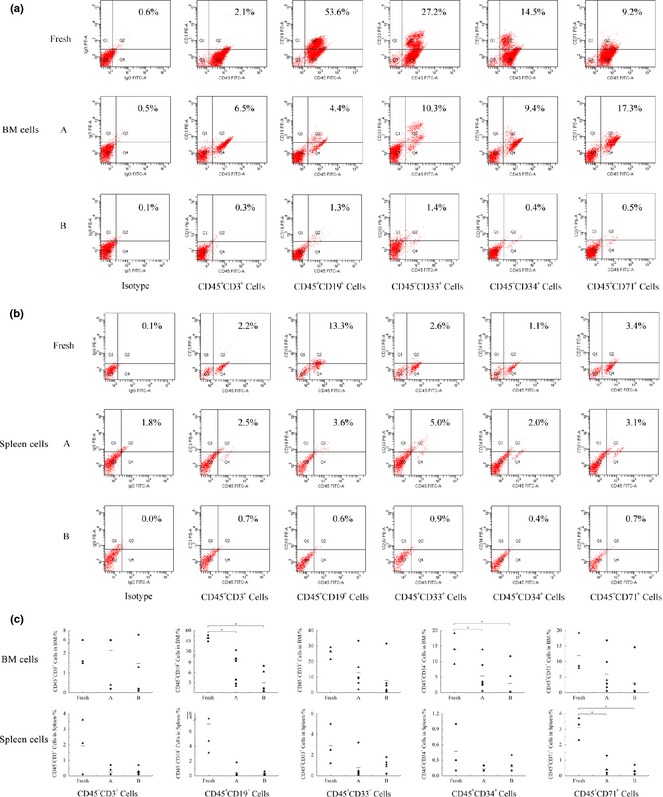
Figure 3.

Multilineage reconstitution of expanded cells in bone marrow and spleen cells of recipient mice in different groups. (a) Representative flow cytometric analysis of human lineage cells in bone marrow cells of recipient mice, (b) Representative flow cytometric analysis of human lineage cells in spleen cells of recipient mice and (c) Percentages of lineage cells in bone marrow and spleen cells of recipient mice in different groups. Each black symbol represents one mouse of two independent experiment, the horizontal bars represent the median values. *Represents significant difference (P < 0.05).
