
Figure 4.
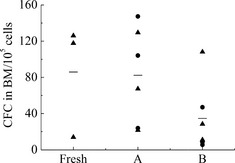
The frequencies of CFCs in bone marrow cells of recipient mice in different groups(/10 5 cells). Each black symbol represents one mouse of two independent experiment, the horizontal bars represent the median values.
Official websites use .gov
A
.gov website belongs to an official
government organization in the United States.
Secure .gov websites use HTTPS
A lock (
) or https:// means you've safely
connected to the .gov website. Share sensitive
information only on official, secure websites.
The frequencies of CFCs in bone marrow cells of recipient mice in different groups(/10 5 cells). Each black symbol represents one mouse of two independent experiment, the horizontal bars represent the median values.