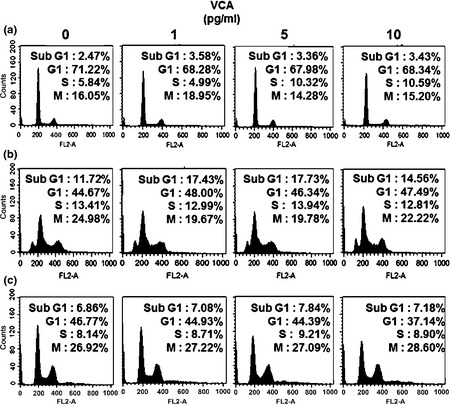
Figure 2.

Cell cycle analysis of each group depend on VCA concentration. Cell cycle analysis of (a) naïve PDSCs, (b) immortalized PDSCs and (c) HepG2 when treated with various concentrations of VCA, using FACS analysis. Numbers of cells in each phase of the cell cycle are indicated as percentages (%).
