
Figure 4.
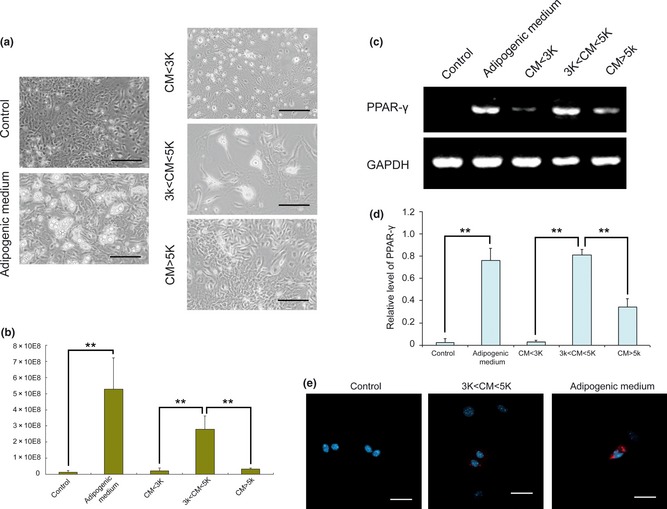
Active components of conditioned medium, between 3 and 5 kDa. (a) Different components of CM without FBS were separated by ultra centrifugation. All three components, as well as controls, were supplemented with 10% FBS and insulin. MSCs cultured in these media for 1 week showed different levels of adipogenic differentiation. Bar = 50 μm (b) MSCs were then fixed and stained in oil‐red O. Pixels of positive areas were calculated using imagej, to show amounts of lipid formed in MSCs. **P < 0.01. (c) Expression of PPAR‐γ was detected by RT‐PCR. GAPDH was used as internal control. (d) Signal intensities of PPAR‐γ and GAPDH on agarose gel were quantified to estimate relative levels of PPAR‐γ. **P < 0.01. (e) Expression of PPAR‐γ was visualized using secondary antibodies conjugated to rhodamine. Nuclei were counterstained with DAPI. Bar = 10 μm.