
Figure 2.
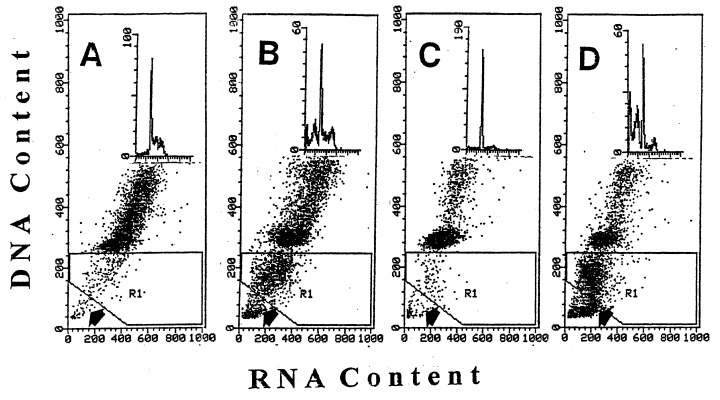
Effect of Onc, RA, and combined treatment with Onc + RA on cell cycle and apoptosis of HL‐60 cells: bivariate analysis of cellular DNA and RNA content. Bivariate distributions (scatterplots) of DNA vs. RNA (stained with AO) of HL‐60 cells, untreated (a) and treated with Onc (b), RA (c) and Onc + RA (d) for 72 h. Apoptotic cells are recognized as the cells with fractional DNA content (located in region 1; R1).Very late apoptotic cells (necrotic phase of apoptosis) have minimal DNA content ( Darzynkiewicz et al. 1997 ) and are located below the R1 gate. Insets show the DNA content histograms of these cells.