
Figure 6.
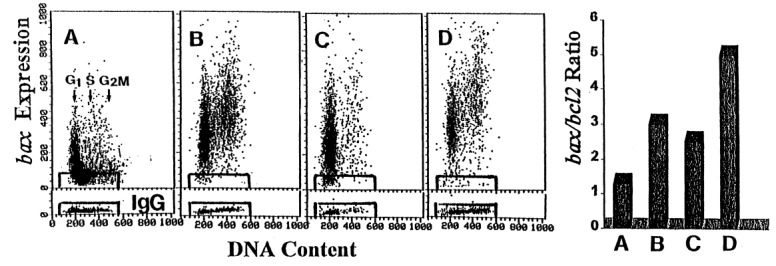
Effect of Onc, phenylbutyrate and Onc + phenylbutyrate on expression of Bax and Bcl‐2 proteins in JCA‐1 cells. Panels a‐d: Bivariate distributions of Bax immunofluorescence vs. DNA content of the untreated JCA‐1 cells (a), JCA‐1 cells incubated in the presence of 42 µM Onc (b), 1 m m phenylbutyrate (c) and 42 µM Onc plus 1 m m phenylbutyrate (d), all for for 72 h. Cells immunostained with isotype IgG served as control; the rectangles that delineate the limits of the IgG background fluorescence are superimosed on the scatterplots. Right panel (bar diagram) Expression of Bcl‐2 in JCA‐1 cells was measured (not shown) similar to that of Bax (shown in panels a‐d), the mean values of Bax and Bcl‐2 immunofluorescence were calculated for the measured cell populations, and plotted as a ratio of Bax:Bcl‐2. These ratios are presented in the bar diagram. (a) untreated cells, (b) Onc, (c) phenylbutyrate, and (d) Onc plus phenylbutyrate‐treated cells.