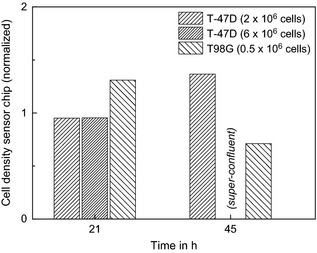
Figure 6.

Density of attached cells on the sensor chips, normalized to cells on the bottom of a 25‐cm 2 flask beside the chip area at two different time points after seeding of cells. The images were taken during the oxygen measurements at 4% oxygen in the incubator, see Fig. 5. The cell numbers in brackets refer to the amount of cells seeded at time zero. The culture with 6 × 10⁶ T‐47D cells seeded was super‐confluent at 45 h. Therefore, no data could be taken from the microscopy images.
