
Figure 2.
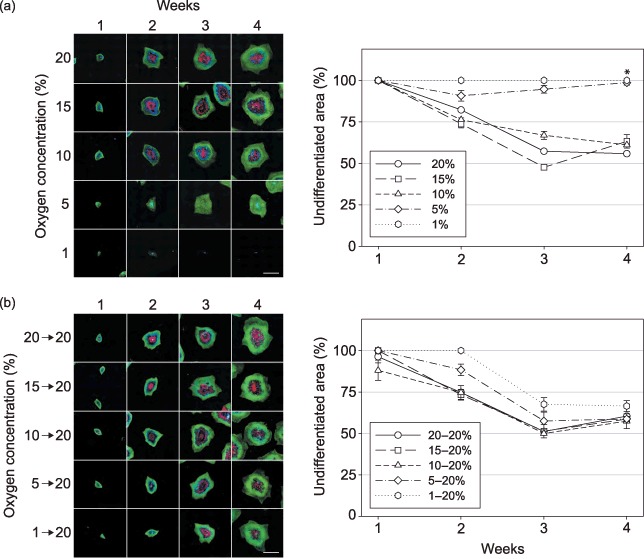
The effect of short‐term hypoxic treatment and re‐oxygenation on the frequency of spontaneous differentiation of hESCs. (a) The CLS1 line was sub‐cultured by microdissection and grown for a period of 4 weeks at four different levels of hypoxia, covering the range from 1% to 15% of oxygen in the atmosphere. The undifferentiated zones were revealed through the expression of Oct4 (green), the areas of differentiation by detection of SSEA1 (red), and nuclei were counterstained with Hoechst 33342 (blue). The progress of spontaneous differentiation was determined by comparing the extent of Oct4‐positive areas to the total surface of respective colonies. (b) After having been grown for a period of 4 weeks in hypoxic conditions, the CLS1 line was passaged and transferred to oxygen concentration of ambient air. The analysis of spontaneous differentiation was done as with hypoxic cultures (a). The images are mosaics of 20 single fields at 2.5‐fold magnification, and the scale bars correspond to 4 mm. Each point on the graphs represents an average of two independent experiments, where error bars denote standard error of mean. Asterisk indicates a significant difference (P < 0.05) between hypoxic culture at 5% and control normoxic culture 20% oxygen. SSEA, stage‐specific embryonic antigen; hESC, human embryonic stem cell.