
Figure 3.
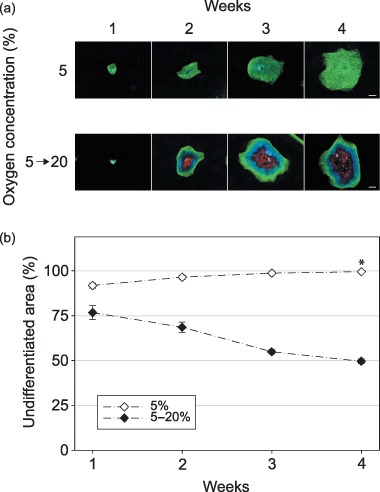
The effect of long‐term hypoxic treatment and re‐oxygenation on the frequency of spontaneous differentiation within the colonies of hESCs. Prior to this experiment, the CLS1‐LT line was maintained in hypoxia of 5% oxygen for over 18 months. (a) After sub‐culturing by mechanical microdissection, and further growth in identical hypoxic conditions or replacing into normoxic conditions corresponding to ambient air, the undifferentiated zones were revealed through the expression of Oct4 (green), the areas of differentiation by detection of SSEA1 (red), and nuclei were counterstained with Hoechst 33342 (blue). The images are mosaics of 144 single fields at 10‐fold magnification, and the scale bars correspond to 1 mm. (b) The progress of spontaneous differentiation was determined from the ratio of Oct4‐positive areas to the total surface of respective colonies. The plots are based on averages from two independent experiments and error bars denote standard error of mean. Asterisk indicates a significant difference (P < 0.05). SSEA, stage‐specific embryonic antigen; hESC, human embryonic stem cell.