
Figure 2.
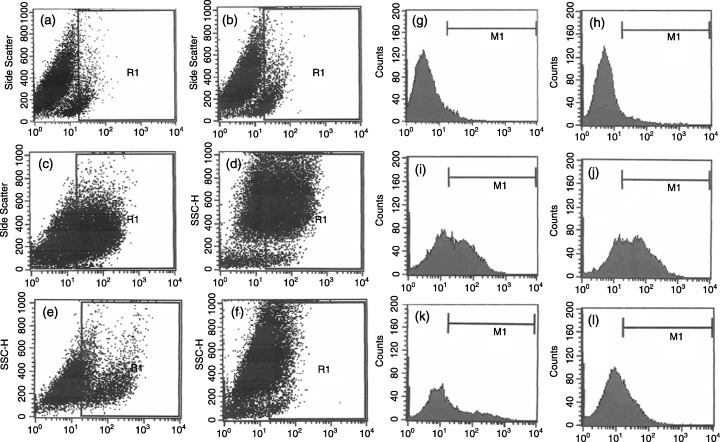
Immunophenotyping of NTERA‐2 cells by flow cytometry. Flow cytometric analysis showing NTERA‐2 cells immunoreactive to the cell surface antigens, by two‐dimensional dot plot and one dimensional histogram analysis, respectively. (a) and (g) mouse IgG was used as an isotype control, and (b) and (h) SSEA‐1 staining as negative control. Single cell suspension of NTERA‐2 cells were labelled with FITC‐coupled antibodies against (c) and (i) SSEA‐3 (53.19%); (d) and (j) SSEA‐4 (66.23%); (e) and (k) TRA‐1‐60 (32.94%); and (f) and (l) TRA‐1‐81 (28.48%). The percentage of cells positive for individual markers was obtained from the region statistics and histogram statistics performed by the FACS calibur flow cytometer with the help of Cell Quest software (Becton Dickinson); dot plot of SSC versus the antigen of interest (gated population) in R1 region; data are representative of three independent experiments (n = 3).