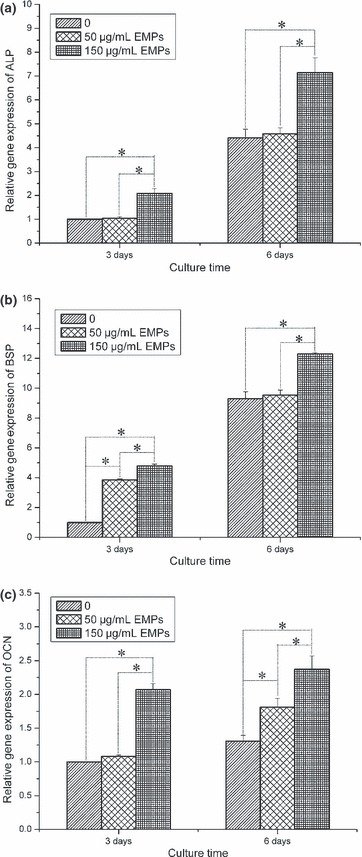
Figure 4.

Real‐time PCR analysis of osteogenic differentiation gene expression in pBMSCs treated with 0, 50 and 150 μg/ml EMPs at 3 and 6 days. (a) alkaline phosphatase (ALP), (b) bone sialoprotein (BSP), (c) osteocalcin (OCN). All values normalized to GAPDH (*P < 0.05).
