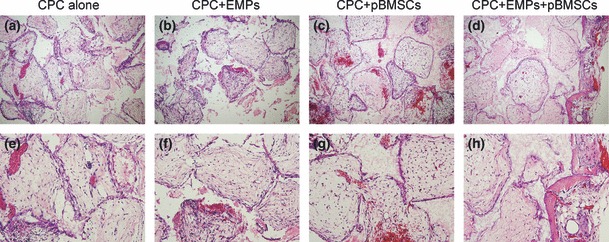
Figure 5.

Representative histological images of implants at 2 weeks post‐surgery. (a) and (e) CPC alone group, (b) and (f) CPC + 150 μg/ml EMPs group, (c) and (g) CPC + pBMSCs group, (d) and (h) CPC + 150 μg/ml EMPs + pBMSCs group (a, b, c, d ×100; e, f, g, h ×200). A slight amount of new bone formation was found in the CPC + 150 μg/ml EMPs + pBMSCs group, whereas no new bone was found in other groups.
