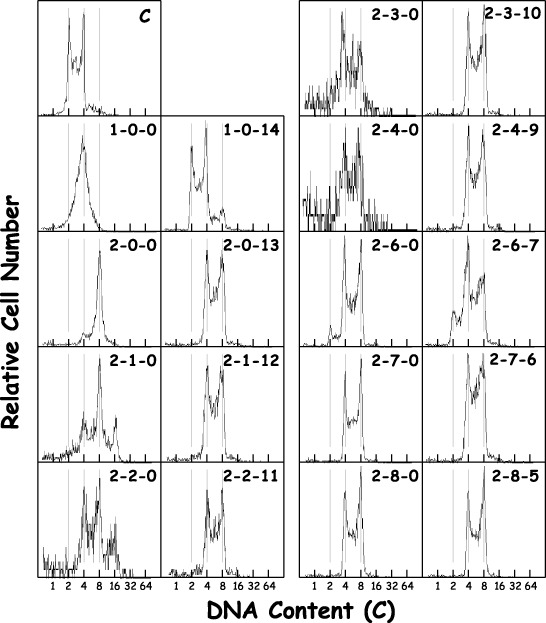
Figure 2.

Changes in DNA histograms of 2nH1 cells exposed to DC. Exponentially growing 2nH1 cells were exposed to 270 nm DC for 1 or 2 days and then released from the exposure. The three hyphened numerals represent the duration (day) of DC exposure, the time (day) after the drug removal and the time (day) after the first sub‐culturing, in that order. The abscissa represents DNA content (C, complement). Vertical grey lines were drawn to facilitate understanding. Panel C is the control.
