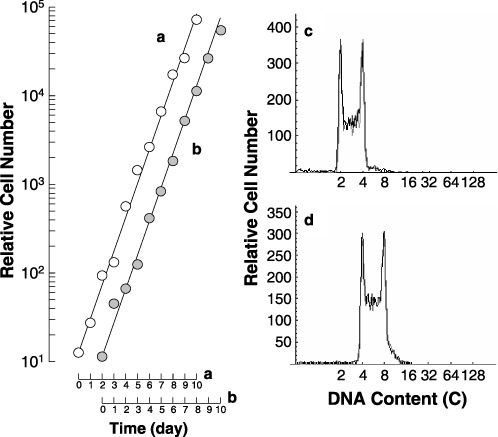
Figure 3.

Growth curves (a and b), synthesized histogram (grey‐line histograms of c and d) and DNA histograms (black‐line histograms of c and d) of 2nH1 (a and c) and 4nH1 (b and d) cells growing exponentially in culture flasks. In the panels c and d, the synthesized (grey line) and observed (black line) histograms are superposed. Solid lines were drawn in the growth curves to facilitate understanding. In the DNA histograms, the abscissa represents DNA content (C, complement).
