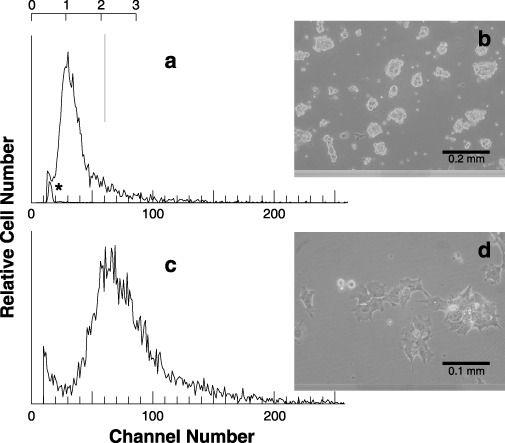
Figure 5.

Volume distribution (a and c) and phase‐contrast micrographs (b and d) of exponentially growing 2nH1 (a and b) and 4nH1 (c and d) cells. Cell volume was measured using a Coulter counter. The vertical line and scale were drawn to facilitate understanding. In the panel a, the distribution of standard spheres (*) is superimposed.
