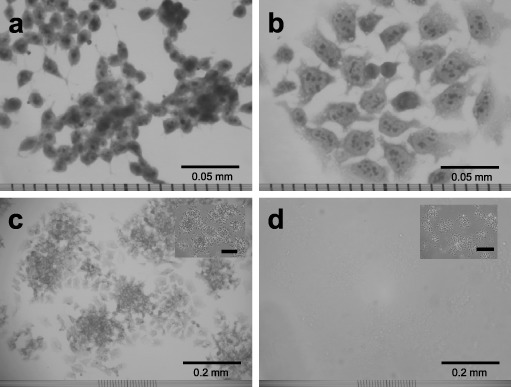
Figure 6.

Microphotographs of 2nH1 (a) and 4nH1 cells (b, c and d) growing exponentially. Cells were stained with haematoxylin–eosin (a and b) or for alkaline phosphatase activity (c and d). Photograph d is a negative control in which cells were stained without substrate. The inserts in c and d show phase‐contrast microphotographs of the respective main fields.
