
Figure 2.
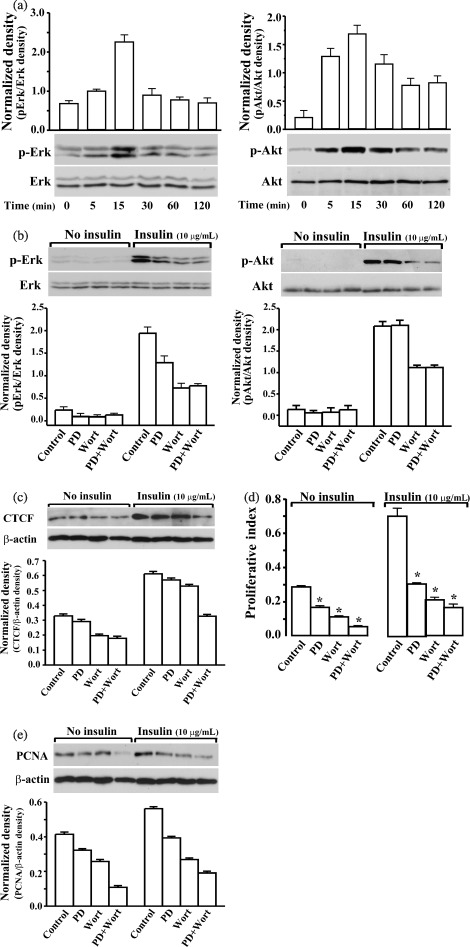
Effects of suppressing insulin‐induced activation of Erk and Akt on CTCT expression, and cell proliferation. (a) Time‐dependent activation of Erk and Akt stimulated by insulin (10 µg/mL). (b) Effects of PD98059 (PD) and wortmannin (Wort) on inhibition of insulin‐induced activation of Erk and Akt, respectively. (c) Effects of PD98059 (PD) and wortmannin (Wort) on insulin‐stimulated CTCF expression determined by Western blot analysis. (d) Effects of PD98059 (PD) and wortmannin (Wort) on insulin‐induced proliferation determined by MTT assay. (e) Effects of PD98059 (PD) and wortmannin (Wort) on insulin‐induced proliferation determined by measuring PCNA expression. Cells were harvested at indicated time points after insulin treatments. PD98059 (20 µm) and wormannin (1 µm) were added to serum starvation‐synchronized cells, individually or together, 30 min prior to insulin treatment (10 µg/mL). Phosphorylated Erk and Akt levels were determined by Western blot analysis. Total amounts of Erk and Akt were measured as loading controls. Cells were harvested at 15 min, 6 h or 24 h after insulin treatment for measurements of Erk and Akt, CTCF and PCNA, or MTT assays, respectively. Asterisks (*) represent significant difference analysed by Student's t‐test (n = 4 or 6, P < 0.05).