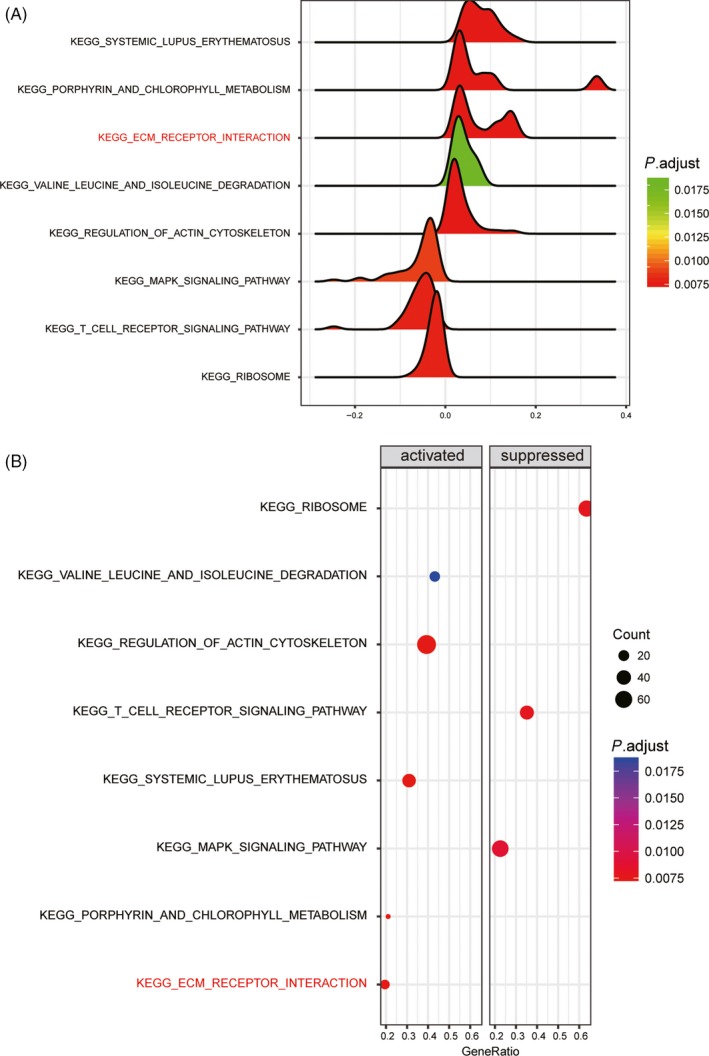
Figure 4.

Results of Kyoto encyclopedia of genes and genomes (KEGG) analysis. A and B, The KEGG analysis revealed differentially modulated pathways in the IPAH group compared to the normal group, including the extracellular matrix (ECM) receptor interaction pathway. In the dotplot, the graph size represents the number of genes. The colour represents the P value. In the joyplot, the enrichment significance (the adjusted P value) is reflected by the colour intensity of the peaks. Pathways with ridges on the left side of 0 were downregulated, while those with ridges on the right side of 9 were upregulated. The gene ratio in the horizontal axis represents the proportion of differential genes in the gene set
