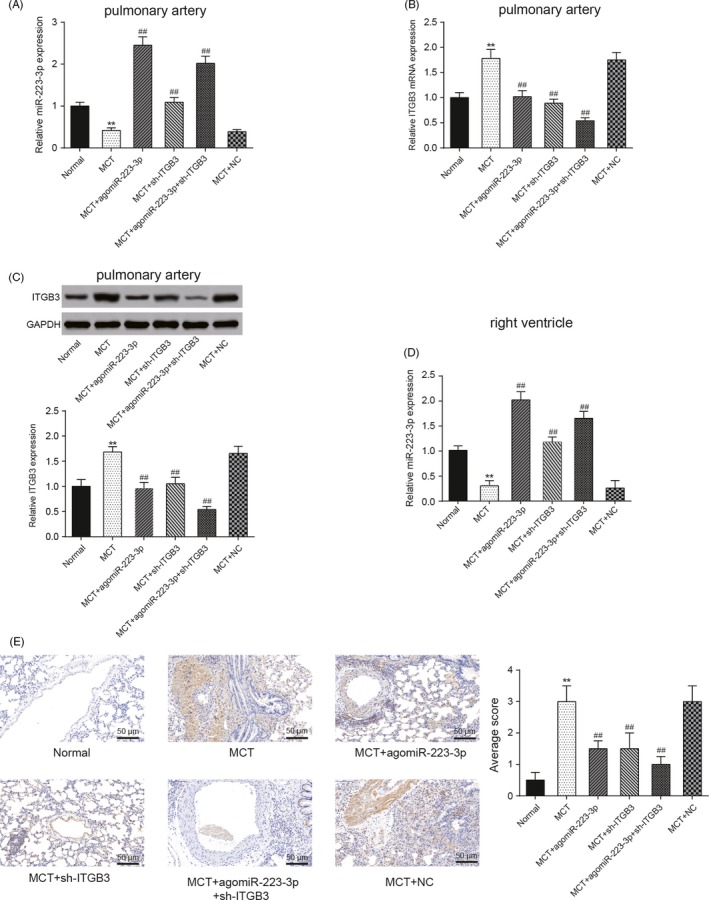
Figure 14.

MiR‐223‐3p expression in the pulmonary artery and right ventricle, and ITGB3 expression in the pulmonary artery. A, MiR‐223‐3p expressions in the pulmonary artery of each group, as measured by qRT‐PCR. B, ITGB3 expressions in the pulmonary artery of each group, as measured by qRT‐PCR. C, ITGB3 protein expression in pulmonary artery of each group, as measured by Western blot. D, The miR‐223‐3p expressions of each group in right ventricle. E, IHC analysis of ITGB3 expressions in each group. Monocrotaline (MCT) + NC: MCT + negative control of MCT + agomiR‐223‐3p and MCT + sh‐ITGB3, n = 8 per group; all experiments were performed in triplicate. Magnification ×200, scale bar: 50 µm, **P < 0.01 compared with the normal group; ## P < 0.01 compared with the MCT group
