Figure 2.

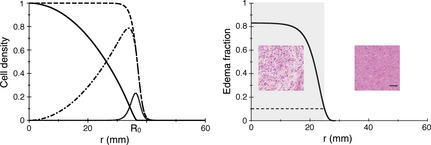
Left: Profiles of cell densities before and after RT. The dashed (respectively solid) black curve corresponds to the cell density profile just before (resp. after) RT. The cell density just after RT is obtained by multiplying the cell density just before RT by a parabola‐shaped function that crosses the horizontal axis at x = R 0. The dotted‐dashed curve is the difference between the solid and the dashed black curves, and represents the cell density that has been killed by RT. The dotted black curve is the density of cells that has been created by proliferation during 6 weeks, between t = −0.12 year and t = 0. The parameters are common to all the curves: κ = 7.0 year−1, D = 1.75 mm2/year, λ = 0.79 year−1, x = 0.60. Right: Example of an oedema fraction curve, at the onset of RT. The parameters are the following: κ = 1.8 year−1, D = 0.9 mm2/year, λ = 0.17 year−1, x = 0.97 (patient 12). The value of oedema fraction 0.1 (dashed line) is the threshold between the visible part of the tumour on a T2‐weighted MR image (indicated by a grey rectangle) and the invisible part. For the same patient, samples from a biopsy (haematoxylin and eosin staining) inside the MRI‐defined abnormalities are associated with a high fraction of oedema in the tissue [80%, as measured in 14], whereas outside the MRI‐defined abnormalities, the fraction of oedema is lower and reaches zero for normal tissue. The black bar represents 50 μm.
