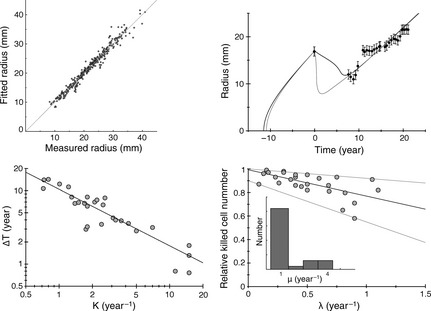
Figure 6.

Top left: The tumour radii obtained by simulations for the 28 patients are plotted against the experimental radii measured on clinical pictures. The coefficient of determination of the linear regression is R 2 = 0.96. Top right: Example of the series radius‐versus‐time for a patient, that can be fitted with different set of parameters, with a comparable mean square difference between the simulated and the experimental data, χ2. In this case, the uncertainty on the measure of Δt is large (see Fig. 7 left, patient 4). Bottom left: The gain of lifetime due to RT ΔT is plotted against κ, in a log‐log scale. The equation of the linear regression is y = 10.4/x 0.76. Bottom right, inset: histogram of distribution of the oedema production μ obtained when fitting all the patients. The relative cell number killed by RT is plotted against the draining coefficient λ, with the best linear regression (y = −0.22x + 0.99) and the two linear curves that comprise all the data points (y = −0.08x + 1 and y = −0.35x + 0.9).
