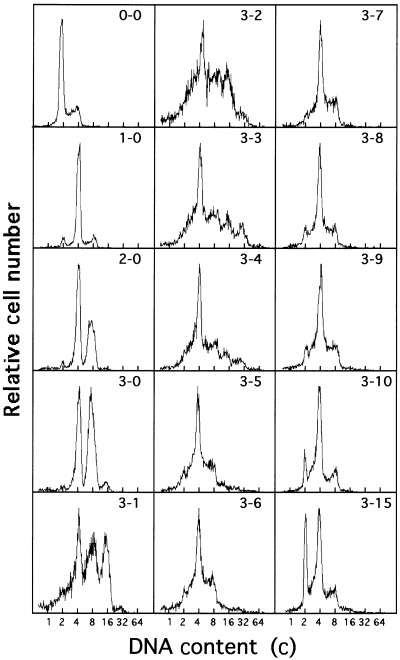
Figure 1.

Changes in DNA fluorescence histograms of V79 cells after the addition and removal of K‐252a. Exponentially growing V79 cells were exposed to K‐252a at a concentration of 800 n m for 3 days. The cells were released from the drug and cultured again with subcultures. Paired numerals in the histogram represent the time (days) of the drug removal and the time (days) after removal, in that order. The abscissa represents the relative DNA content (c, complement).
