
Figure 4.
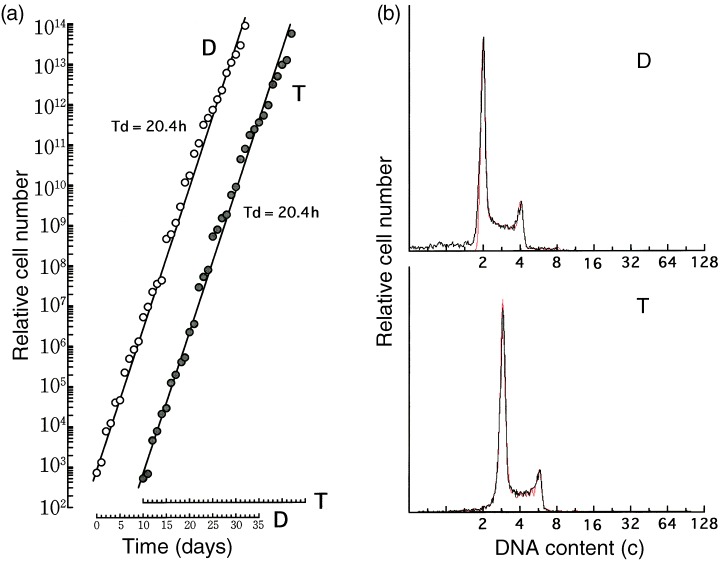
Growth curves (a) and representative CASL outputs (b) of diploid (D) and triploid (T) V79 cells. Exponentially growing diploid and triploid V79 cells were cultured long term with daily subcultures. Changes in the relative cell number of diploid (open circle) and triploid (closed circle) V79 cells were determined (a). The abscissa represents the time (day) after the drug removal. Solid lines were drawn to facilitate understanding. In b, solid (black) and dotted (red) lines represent experimental and synthesized histograms, respectively.