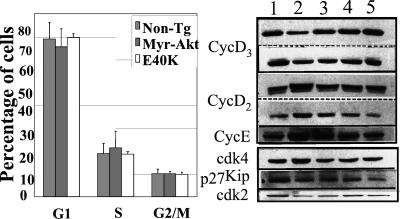
Figure 3.
Cell cycle distribution and expression of cell cycle regulators in freshly isolated transgenic and nontransgenic control thymocytes. (Left) Cell cycle distribution of freshly isolated thymocytes from nontransgenic, MyrAkt, and AktE40K transgenic mice. There were four 6- to 8-week-old, age- and sex-matched mice per group. (Right) Expression of cell cycle regulators in freshly isolated thymocytes from nontransgenic control and transgenic mouse lines. Lanes: 1, nontransgenic; 2, MyrAkt1 M-1; 3, MyrAkt1 M-9; 4, Akt1-E40K E-3; and 5, Akt1-E40K E-4. For cyclin D3 and cyclin D2, the results of two independent experiments are shown. The same blots were probed with the antibodies to cyclin D2 and cyclin D3. The intensity of individual bands was measured by densitometry. Band intensity ratios were as follows: cyclin D3, nontransgenic vs. MyrAkt M-1 transgenic thymocytes = 2.23 and 1.86 in the two experiments shown; cyclin D2, nontransgenic vs. MyrAkt M-1 transgenic thymocytes = 0.42 and 0.45; cyclin E, nontransgenic vs. MyrAkt M-1 transgenic thymocytes = 0.25; cdk2, nontransgenic vs. MyrAkt M-1 transgenic thymocytes = 2.89.

