
Figure 1.
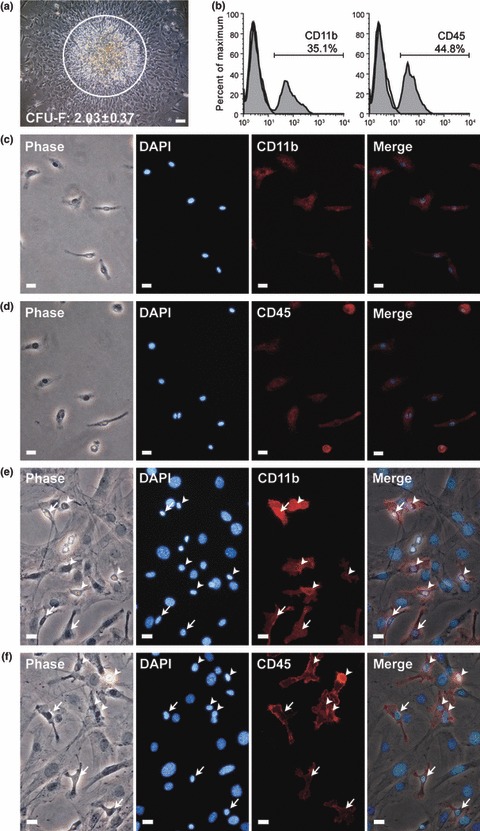
HCs contaminating MSCs from mouse bone marrow adherent cultures. (a) Phase‐contrast image of mMSC colony from primary bone marrow adherent culture. A large number of small spherical cells, characteristic of lymphohaematopoietic cells (circled), engaged upon mMSC colonies as a second layer. (b) Primary marrow adherent culture was analysed for expression of haematopoietic markers, CD11b and CD45, by flow cytometry. (c, d) Immunofluorescence staining (red) showed CD11b (c) and CD45 (d) expression on unlifted marrow adherent cells. (e) Phase‐contrast image of mouse bone marrow plastic‐adherent cells, first passage (seeding density: 5 × 10⁴ cells/cm2). Immunofluorescence staining (red) showed CD11b+ and CD45+ HCs either adhered to plastic (arrow) or engaged on mMSCs (arrowhead). Nuclei counterstained with DAPI (blue). Scale bars represent 100 μm (a) and 50 μm (c–f).