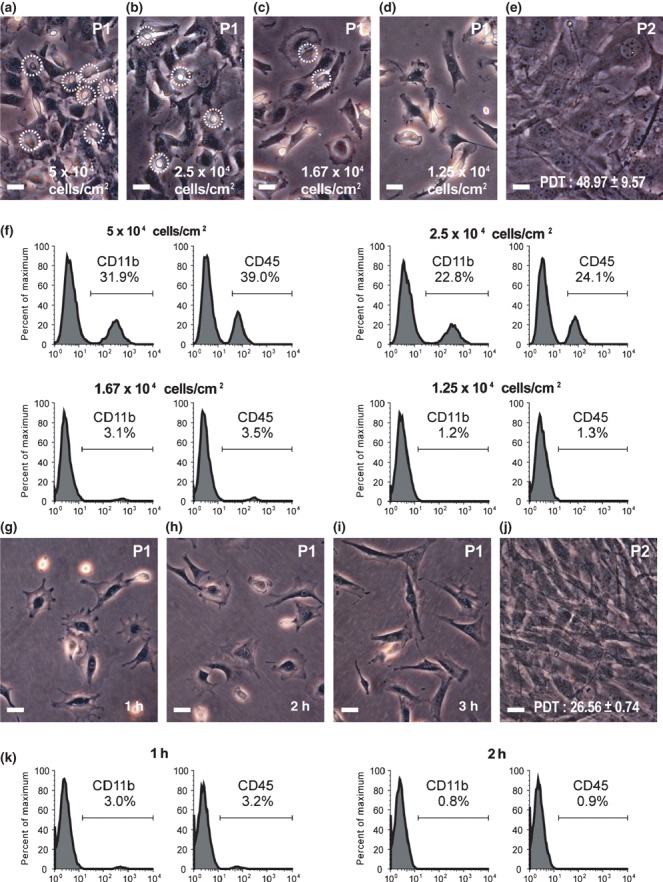
Figure 3.

Effects of seeding density and adhering time on purity and proliferative competence of isolated mMSCs. (a–d) Phase‐contrast images of mouse bone marrow adherent cells from different seeding densities demonstrated that engaged HCs (circled) gradually became depleted with increasing dilutions. (e) Replating of confluent cells from lowest density culture (d, 1.25 × 10⁴ cells/cm2) showed PDT of 48.97 ± 9.57 h. (f) After trypsin digestion, percentage of HCs (CD11b+ and CD45+) from different density cultures (a–d) was demonstrated by FACS analysis using anti‐CD11b and anti‐CD45 monoclonal antibodies. (g–i) Phase‐contrast images of mouse bone marrow adherent cells after seeded at density of 1.25 × 10⁴ cells/cm2 for 1–3 h. (j) Replating of cells after 3 h adherence (i) at density of 5 × 10⁴ cells/cm2 had PDT of 26.56 ± 0.74 h. Scale bars represent 50 μm. (k) After trypsin digestion, percentage HCs (CD11b+ and CD45+) from various degrees of adherent culture was demonstrated by FACS analysis using anti‐CD11b and anti‐CD45 monoclonal antibodies.
