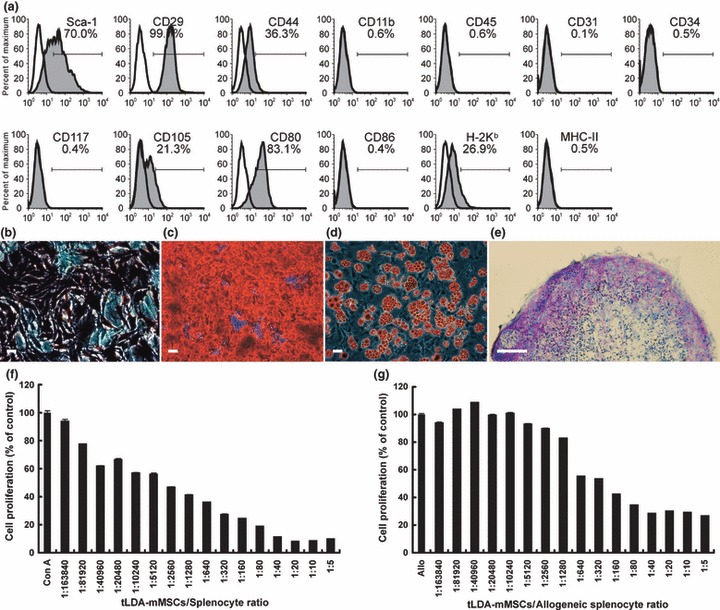
Figure 4.

Characterization of tLDA‐mMSCs. (a) FACS analysis of tLDA‐mMSCs. A homogeneous confluent monolayer of tLDA‐mMSCs was trypsinized and analysed by staining with various antibodies. Respective isotype control shown as open histogram. (b–e) Osteogenic, adipogenic and chondrogenic capabilities of tLDA‐mMSCs. Osteogenic capability characterized by ALPase activity (b) and ARS staining (c) after 2 weeks’ and 3 weeks’ induction respectively. Adipogenic capability characterized by oil red O staining (d) after 2 weeks’ induction. Scale bars represent 50 μm (b–d). Chondrogenic capability evaluated by histological section micromass pellet cultures after 3 weeks’ induction. Glycosaminoglycan content of the pellet was revealed by toluidine blue staining (e). Scale bar represents 100 μm. (f–g) Immunosuppressive properties of tLDA‐mMSCs. In mitogen proliferation assays (f), responding splenocytes from C57BL/6 mice were stimulated with ConA in absence or presence of graded numbers of autologous tLDA‐mMSC (n = 6 for each group). In MLR culture (g), responding splenocytes from C57BL/6 mice were cultured with an equal number of mitomycin C‐treated BALB/c splenocytes, with or without graded number of C57BL/6 tLDA‐mMSCs (n = 6 for each group). Results shown as percentage of cell proliferation in comparison to control cell proliferation. Data expressed as mean ± SD of triplicate of two separate experiments. Allo indicates allogeneic splenocyte culture.
