
Figure 3.
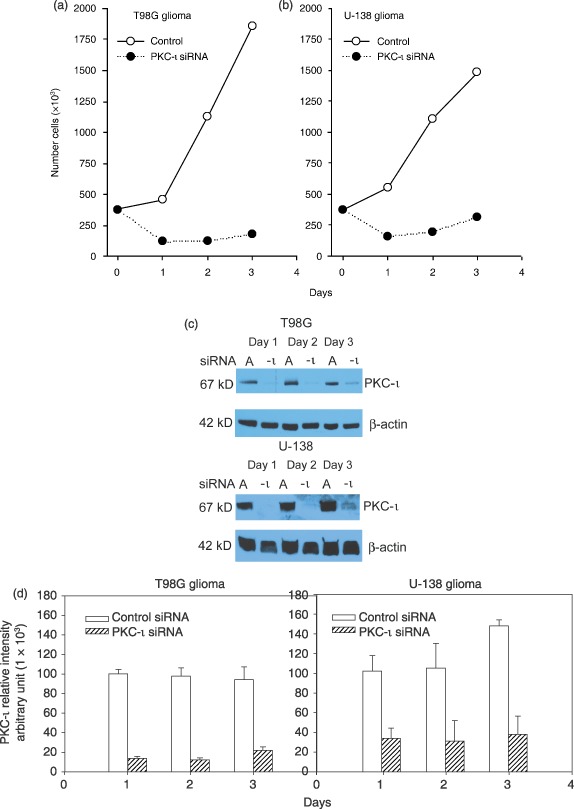
Effects of PKC‐ι siRNA on proliferation of T98G and U‐138MG glioma cells and PKC‐ι protein content. Cells were plated in 75 cm2 flasks at a density of 3.75 × 10⁵ cells/flask. Twenty‐four hours after plating, cells were incubated with either siRNA‐A (100 nm; vehicle–control) or PKC‐ι siRNA (100 nm) for 6 h according to manufacture's instructions (Santa Cruz Biotechnology). During the 3‐day incubation viable cells were quantified by trypan blue dye exclusion assay (a, T98G; b, U‐138 MG). Open symbols ( ) represent control (siRNA‐A) treated cells, solid symbols (
 ) represent cells treated with PKC‐ι siRNA (100 nm). Western blots of PKC‐ι present in U‐138MG and T98G cells, treated with PKC‐ι siRNA (100 nm) for three days (c). Band intensity was quantified by densitometry (d). Data are representative of three experiments.