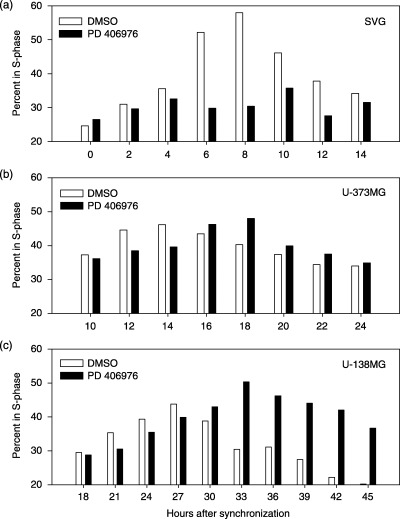
Figure 4.

Effects of PD 406976 on SVG‐transformed glial cells (a), U‐373MG (b) and U‐138MG glioma (c) DNA synthesis phase as a function of time. Percentage of cells in S‐phase. Open bars represent control (DMSO) treated cells; solid bars represent cells treated with PD 406976 (2 µm). Number of events collected was 40 000 per time point and treatment group. Data are representative of three experiments with SVG‐transformed glial cells and U‐373MG glioma cells and two experiments with U‐138MG glioma cells.
