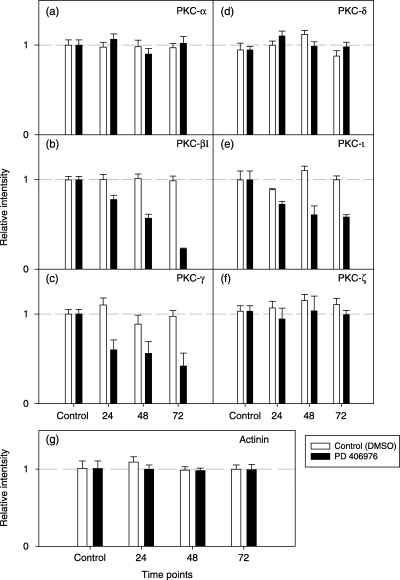
Figure 9.

Normalization of SVG cells western band intensity. The intensity of each band was measured by the Scion Image program (Scion Corporation, Frederick, MD, USA). Samples treated with PD 406976 band intensities were normalized against samples treated with DMSO. Open bars represent control (DMSO‐treated) cells; solid bars represent cells treated with PD 406976 (2 µm).
