
Figure 10.
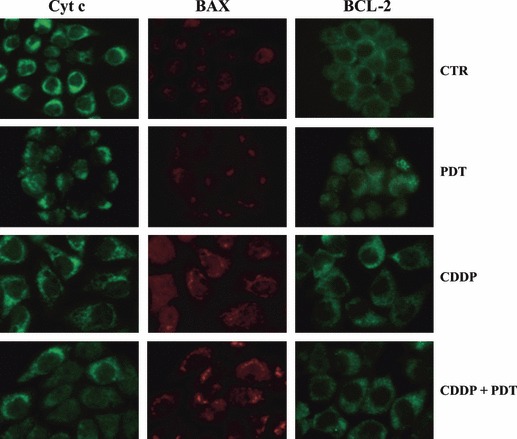
Immunolocalization of cytochrome c, BAX and BCL‐2 proteins in control and treated KYSE‐510 cells. Immunoreaction for cytochrome c, BAX and BCL‐2 in control cells and at 24 h after the end of treatments with PDT alone, CDDP alone (1 μm) and their combination. In response to treatments cyt c is released from mitochondria and can be seen in a diffuse pattern throughout the cell, whereas BAX translocation to mitochondria is evident by punctuate distribution. BCL‐2 show a diffuse staining in control and treated cells, associated with its localization to multiple organelles. Power of magnification 63×. Cells treated with CDDP were about 2‐fold larger than controls.