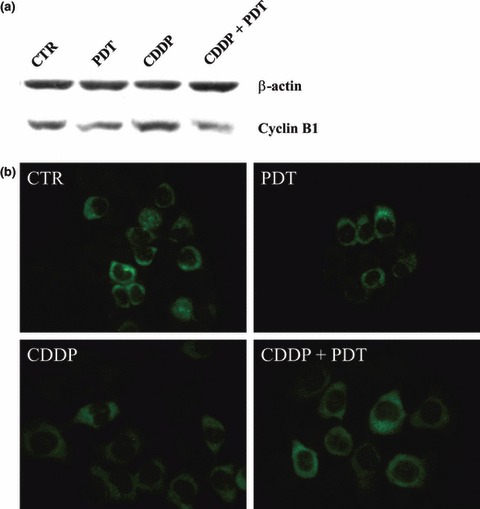
Figure 5.

Expression analyses of cyclin B1 in control and treated KYSE‐510 cells. SDS–PAGE performed 24 h after the end of individual (PDT; CDDP 1 μm) or combined (PDT + CDDP 1 μm) treatments (a). Immunolocalization of cyclin B1 in cells accumulated in S‐ and G2 phases (b).
