Figure 2.

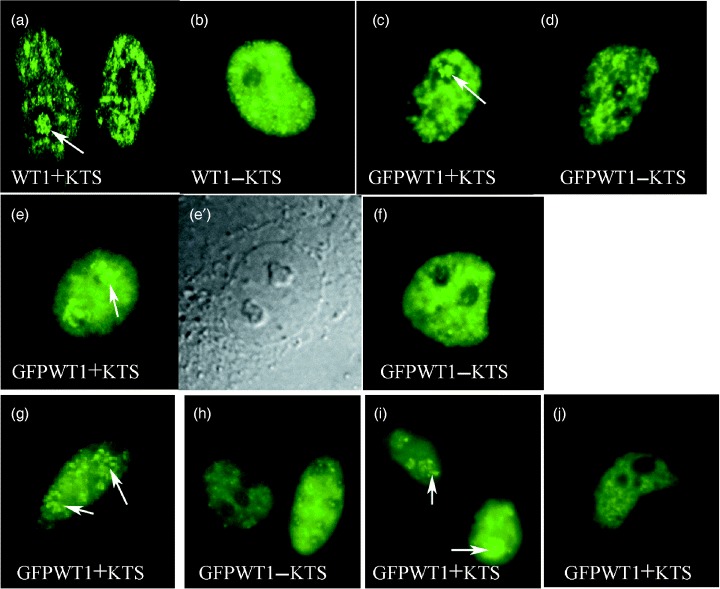
WT1 isoform distribution in mammalian cells (× 600). (a, b) Pattern of non‐fusion WT1 isoform expression in Cos7 cells 48 h after transfection identified using antiWT1 antibody staining. (a) WT1+KTS (b) WT1−KTS. (c–f) Pattern of fluorescent GFPWT1 isoform fusion proteins in live Cos7 cells. (e) Fluorescence showing diffuse/nucleolar distribution of GFPWT1+KTS in Cos7 cells 24 h after transfection. (e′) Phase contrast view of the nucleus in (e). (f) Diffuse/foci distribution of GFPWT1−KTS in Cos7 cells 24 h after transfection. (c, d) Steady state, discrete patterns of GFPWT1+KTS (c) and GFPWT1−KTS (d) Isoforms in Cos7 cells were similar at 48 hpt. (g) Diffuse/nucleolar (GFPWT1+KTS) and (h) diffuse/foci (GFPWT1−KTS) expression patterns were also seen in HeLa cells 7 h after transfection. (i,j) Diffuse/nucleolar expression of GFPWT1+KTS were seen in MCF7 cells 7 h after transfection (i) before dispersing to a mature discrete localization at 24 hpt (j). Arrows indicate localization of WT1+KTS to the nucleolus.
