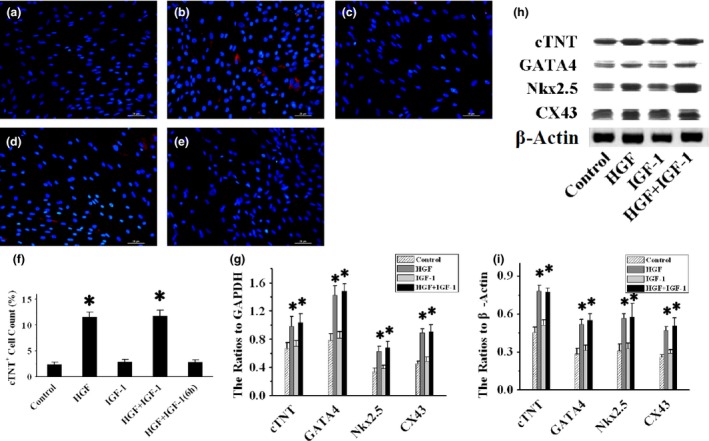
Figure 5.

BMSC differentiation into cardiomyocytes. Representative anti‐cTNT (red fluorescence) staining images of BMSCs exposed to blank control, HGF, IGF‐1 and HGF+IGF‐1 for 1 week, as well as HGF+IGF‐1 for 6 h, are shown in (a)–(e) respectively. Numbers of cTNT‐positive cells are compared in (f). Myocyte‐specific factor cTNT, GATA4, Nkx2.5 and CX43 mRNA expressions were measured by RT‐PCR, and ratios to GAPDH are compared in (g). Representative images of western blots are shown in (h), and ratios of these proteins to β‐Actin are compared in (i). CX43, connexin43; GAPDH, Glyceraldehyde‐3‐phosphate dehydrogenase; RT‐PCR, Reverse transcription polymerase chain reaction. *P < 0.001 versus Control group.
