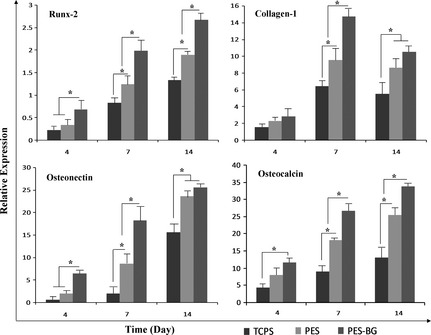
Figure 4.

Relative expression of Runx‐2 , collagen‐1 , osteonectin and osteocalcin on days 4, 10 and 14 in MG‐63 cells on tissue culture polystyrene (TCPS), polyethersulphone (PES) and bioactive glass (BG)‐coated PES (PES‐BG) of period of study (*indicates significant difference between the groups at P < 0.05).
