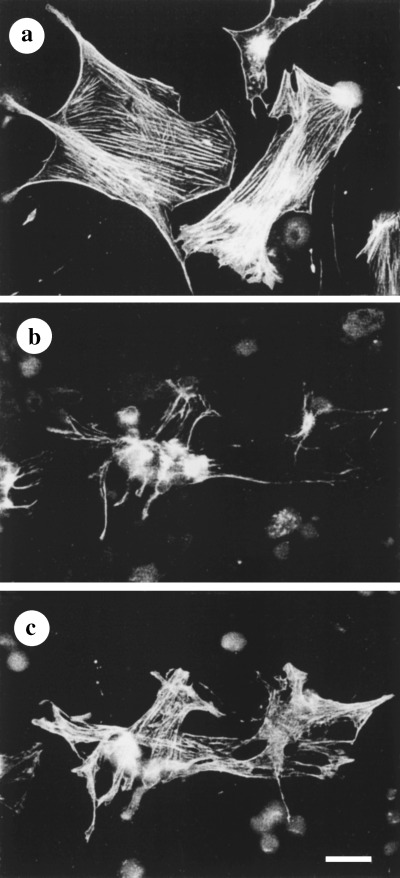
Figure 3.

Differences in the distribution of SMAA and GFAP under high power magnification. (a) EA‐free culture. Stress fibre‐like arrangement of SMAA. (b, c) EA‐treated culture (6 µg/ml EA): localization of GFAP (b) and SMAA (c) in HSC. Some GFAP filaments are observed (b) and there is a relatively dense packing of SMAA filaments (c). Double‐labelling was performed as follows: (a, d) MAb SMAA and Cy3‐conjugated anti‐mouse IgG from goat; (b) antiserum against GFAP and fluorescein isothiocyanate‐conjugated anti‐rabbit IgG from goat. Bar = 50 µm.
